Introduction
Augmented Reality (AR) product visualization is rapidly changing how customers discover, evaluate, and buy physical goods online. Instead of relying on flat images and text, shoppers can now place life-sized, interactive 3D models of products in their real environment using a phone or tablet. For businesses, this isn’t just a novelty — it raises buyer confidence, reduces returns, and shortens the path to purchase. This article explains what AR product visualization is, why it matters, how to implement it with practical best practices, how to measure its business impact, and what pitfalls to avoid. The guidance here is organized with an emphasis on credibility, practical experience, and actionable steps so content creators, product managers, and marketers can apply AR thoughtfully and in ways that align with Google’s EEAT principles demonstrating expertise, authoritativeness, and trustworthiness in the content and approach.
What is AR product visualization and how does it work?
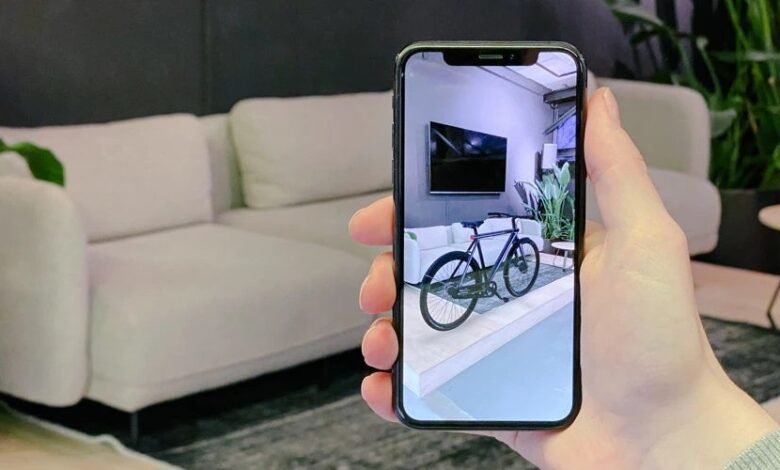
AR product visualization overlays a computer-generated 3D model of a product onto the user’s real-world view through a smartphone, tablet, or AR headset. The technical core involves a textured 3D asset, a lightweight rendering pipeline, and spatial tracking so the object appears anchored and scaled correctly in the physical environment. Users can rotate, move, and sometimes change color, finish, or size in real time. From a business perspective, the workflow includes modeling (creating accurate geometry), texturing (realistic materials), optimization (reducing polygon count and file size), and delivery (embedding the AR experience in apps, websites, or platform-specific AR viewers). Crucially, successful AR visualization balances fidelity with performance: photorealism improves trust, but file size and rendering cost must be controlled to maintain a smooth, accessible experience on consumer devices. When done right, AR bridges the tactile gap of online shopping and lets customers validate scale, fit, and aesthetics before they buy.
Benefits for e-commerce, retail, and B2B sales
AR product visualization delivers measurable business benefits across retail and B2B channels. For e-commerce sellers, interactive AR increases conversion rates by letting customers preview size and style in their own space eliminating guesswork that commonly leads to returns. In furniture, home decor, fashion accessories, and automotive parts, being able to “try before you buy” reduces post-purchase disappointment. For B2B sellers and showrooms, AR enables remote demonstrations and realistic configurators that shorten sales cycles and support complex customization. Marketing teams gain more engaging content for social ads and product pages, while customer support sees fewer fit or compatibility complaints. Beyond conversions, AR boosts brand perception: early adopters are viewed as innovative and customer-centric. When ROI is calculated, companies should track not only direct sales lift but also return rate reduction, average order value uplift (from confident upsells), longer session times, and improved customer sentiment metrics such as NPS or post-purchase surveys.
How to implement AR product visualization
Start implementation with clear goals: reduce returns, improve conversion, or accelerate B2B demos. Next, build accurate 3D assets either by photogrammetry (scanning real objects), CAD conversion, or high-quality modeling. Optimize assets for mobile: reduce polygon count, bake lighting into textures when possible, and use compressed texture formats. Choose a delivery method that matches your audience: WebAR is convenient because it requires no app install, but native apps and platform viewers can provide richer interactivity. Integrate AR triggers into your product pages (“View in your space” buttons), ensure good UX (clear scale indicators, measurement tools, and placement guides), and add fallback imagery for unsupported devices. Test extensively on a representative set of devices to ensure performance and alignment. Finally, document your asset pipeline and version control 3D models so marketing teams can update finishes or variants without redoing the entire process. Prioritize accessibility include clear copy explaining what AR does, permissions prompts, and non-AR alternatives so all customers can shop successfully.
Measuring success: metrics, tracking, and ROI
Quantifying AR impact requires tracking both product engagement and downstream financial metrics. Start with direct usage metrics: number of AR views per product, session duration in AR mode, and interaction depth (rotations, color changes). Tie AR events to conversion funnels: measure conversion rate for users who used AR versus those who didn’t, average order value, and time-to-purchase. Crucially, track returns and reasons for returns to measure reductions in fit/expectation issues. Attribution may require A/B testing or phased rollouts: expose a portion of traffic to AR and compare performance over comparable periods. For B2B deployments, measure demo-to-close ratio and sales cycle length. Calculate ROI by summing incremental revenue (lifted conversions and higher AOV) plus reduced return costs, then subtract implementation and asset maintenance costs. Present results with confidence intervals and avoid small-sample overinterpretation; reliable conclusions come from repeated measurement across categories and seasons.
Common challenges and how to overcome them
AR projects face technical, operational, and cultural obstacles. Technical challenges include device fragmentation (different AR support between operating systems), large asset sizes causing slow loads, and inconsistent lighting leading to unrealistic appearances. Overcome these with progressive enhancement (serve WebAR with fallbacks), aggressive asset optimization, and use of environment probes or light estimation when available. Operationally, producing, versioning, and localizing 3D assets can strain content teams; solve this by establishing a repeatable asset pipeline, reusing modular components, and integrating 3D model management into CMS workflows. Culturally, stakeholders may view AR as a gimmick; mitigate this by starting with a pilot targeted at high-return SKUs and presenting early metrics. Finally, privacy and permissions matter be transparent about camera access and store no unnecessary sensor data. Addressing these challenges intentionally keeps AR projects practical, scalable, and aligned with business outcomes.
Conclusion
AR product visualization is no longer an experimental add-on it’s a practical tool that improves shopping confidence, reduces returns, and creates memorable, purchase-driving experiences. To succeed, companies should focus on accurate 3D assets, mobile performance, clear UX, and strong measurement. Begin with a focused pilot on categories where scale and aesthetics matter most, optimize continuously based on data, and document the asset pipeline so AR can scale across the catalog. With thoughtful execution and clear KPIs, AR becomes a durable competitive advantage that supports modern omnichannel commerce while meeting Google’s EEAT expectations for trustworthy, expert guidance.
Frequently Asked Questions (FAQs)
Q1: Which products benefit most from AR visualization?
Products where scale, fit, or aesthetics are critical furniture, home décor, eyewear, footwear, jewelry, and electronics often see the largest impact from AR visualization because customers need real-world context.
Q2: Do customers need to install an app to use AR?
Not always. WebAR enables in-browser AR experiences without an app install, although native apps or platform viewers can offer richer interactions. Choose based on your user base and desired feature set.
Q3: How much does AR implementation cost?
Costs vary by catalog size, asset complexity, and delivery method. Expect upfront modeling and integration costs and ongoing costs for asset updates. Start with a pilot SKU set to control investment while proving ROI.
Q4: Will AR increase website load times?
Only if assets aren’t optimized. Use compressed textures, lower polygon counts for distant objects, streaming strategies, and smart caching to keep AR lightweight and fast on mobile networks.
Q5: How do I measure AR’s business value?
Track AR views, engagement time, conversion lift, average order value, and return rates. Use A/B testing or phased rollout to build causal evidence of value and calculate ROI inclusive of reduced returns.